乐园一个新时代农民工的随手笔记
乐园一个新时代农民工的随手笔记

Python 使用 matplotlib 画图

本文将介绍如何使用 Python 的 matplotlib 库画图,记录一些常用的画图 demo 代码

安装

1
2
# 建议先切换到虚拟环境中
pip install matplotlib

中文显示

新版的 matplotlib 已经支持字体回退功能,因此可以直接设置字体为 Times New RomanSimSun(宋体)。这样英文会以 Times New Roman 显示,中文会以 宋体 显示
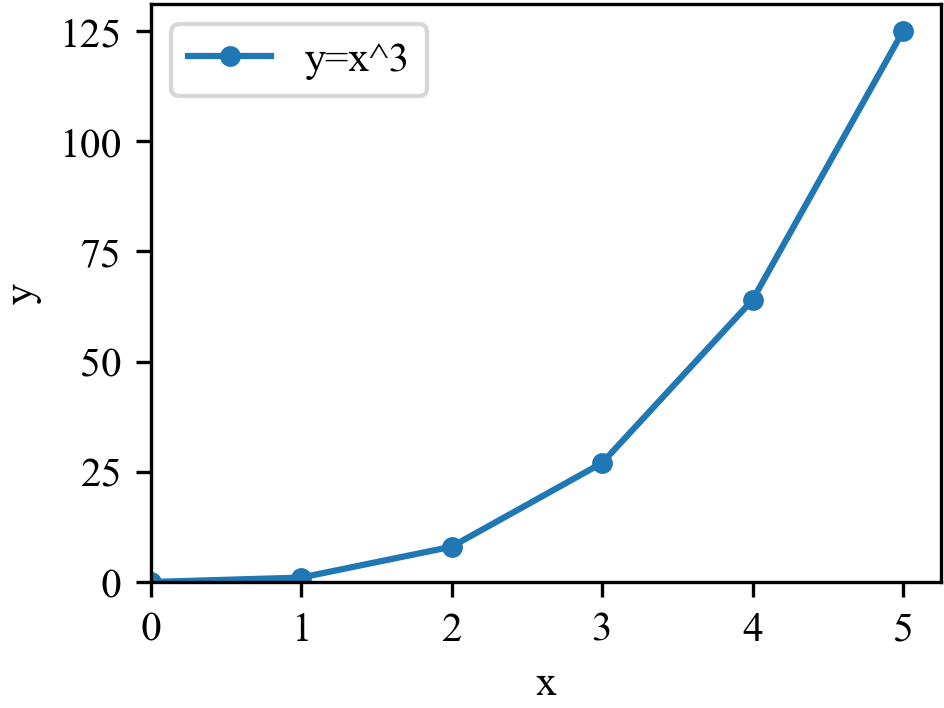
1
2
3
import matplotlib.pyplot as plt

plt.rcParams['font.family'] = ['Times New Roman','SimSun']

折线图、点线图

plot 即可以绘制折线图,也可以绘制点线图,通过 marker 参数设置点的样式,markersize 设置点的大小
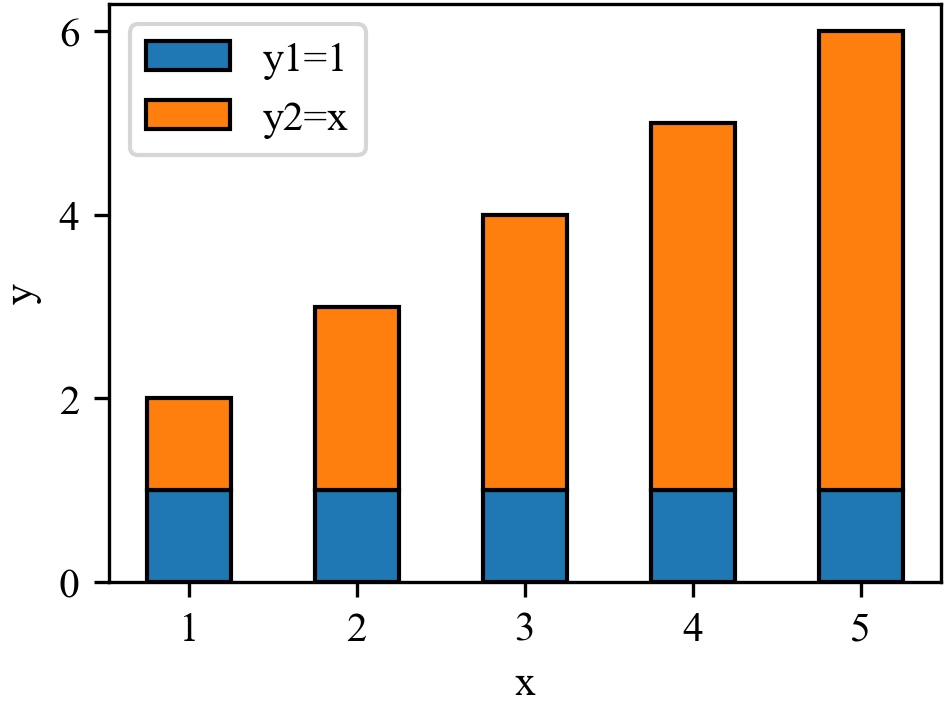
 1
 2
 3
 4
 5
 6
 7
 8
 9
10
11
12
13
14
15
16
17
18
19
20
21
22
23
24
25
26
27
28
import matplotlib.pyplot as plt

# 设置中文字体为 Times New Roman 和 宋体
plt.rcParams['font.family'] = ['Times New Roman','SimSun']

# 生成数据
x = range(0, 6)
y = [i**3 for i in x]

# 绘制点线图
plt.plot(x, y, marker='o', markersize=6, label='y=x^3')

# 添加坐标轴标签
plt.xlabel('x')
plt.ylabel('y')

# 配置坐标轴范围
plt.xlim(0)
plt.ylim(0)

# 添加图例
plt.legend()

# 配置紧凑布局
plt.tight_layout(pad=0.1)

# 保存图片
plt.savefig('plot.png')

点线图

柱状图、堆积柱状图

bar 绘制柱状图,通过 bottom 参数可以绘制堆积柱状图
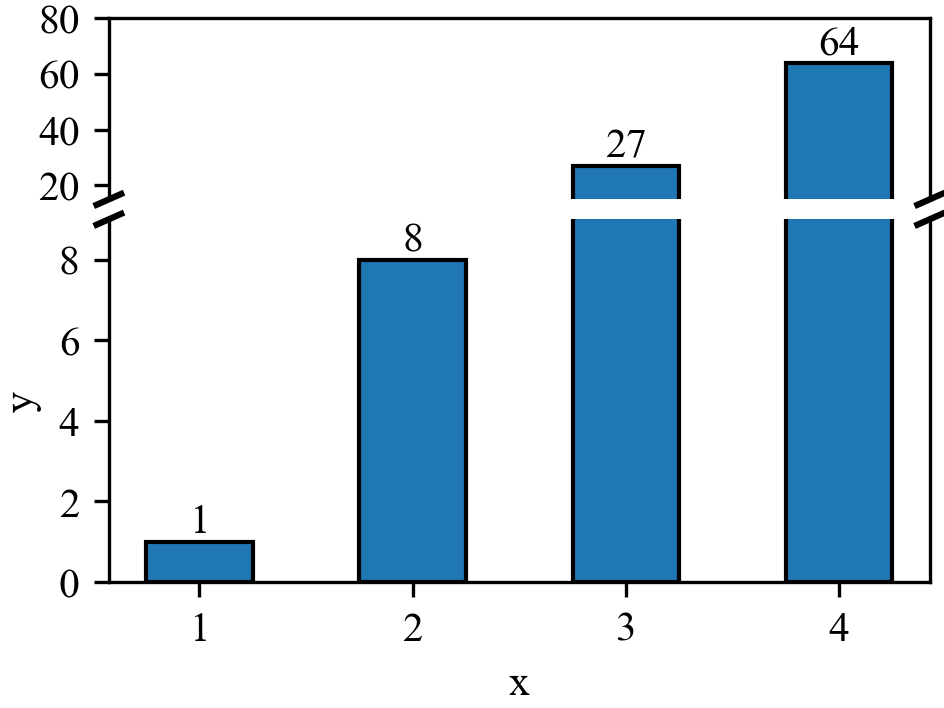
1
2
3
4
5
6
7
8
# 生成数据
x = range(1, 6)
y1 = [1 for i in x]
y2 = [i for i in x]

# 绘制堆积柱状图
plt.bar(x, y1, color='tab:blue', edgecolor='black', label='y1=1', width=0.5)
plt.bar(x, y2, bottom=y1, color='tab:orange', edgecolor='black', label='y2=x', width=0.5)

堆积柱状图

坐标轴断点

有时需要在柱状图中添加 y 轴的断点,可以通过画两个相同的图,并配置不同的 y 轴范围,然后在两个图之间添加截断线的方式来实现

 1
 2
 3
 4
 5
 6
 7
 8
 9
10
11
12
13
14
15
16
17
18
19
20
21
22
23
24
25
26
27
28
29
30
31
32
33
34
35
# 生成数据
x = range(1, 5)
y = [i**3 for i in x]

# 分别绘制上下两个图
b1 = ax1.bar(x, y, color='tab:blue', edgecolor='black', label='y1=1', width=0.5)
b2 = ax2.bar(x, y, color='tab:blue', edgecolor='black', label='y1=1', width=0.5)

# 显示数据
ax1.bar_label(b1, fmt='%d', label_type='edge')
ax2.bar_label(b2, fmt='%d', label_type='edge')

# 配置上图的坐标轴范围
ax1.set_ylim(15)
ax1.set_yticks([20, 40, 60])
# 删掉上图的下边框
ax1.spines['bottom'].set_visible(False)
# 隐藏上图的x轴
ax1.xaxis.set_visible(False)

# 配置下图的坐标轴范围
ax2.set_ylim(0, 9)
ax2.set_yticks([0, 2, 4, 6, 8])
# 删掉下图的上边框
ax2.spines['top'].set_visible(False)

# 添加截断线,由于图高度比例为1:2,所以截断线的y坐标也需要按比例设置
d = .015
kwargs = dict(transform=ax1.transAxes, color='k', clip_on=False)
ax1.plot((-d, +d), (-2*d, +2*d), **kwargs) 
ax1.plot((1 - d, 1 + d), (-2*d, +2*d), **kwargs)

kwargs.update(transform=ax2.transAxes)
ax2.plot((-d, +d), (1 - d, 1 + d), **kwargs)
ax2.plot((1 - d, 1 + d), (1 - d, 1 + d), **kwargs)

坐标轴断点

参考资料

相关内容

请我一杯咖啡吧!
Zeus 支付宝支付宝
Zeus 微信微信
0%